Q1 – 2026: Brandon’s Quarterly Market Commentary
04/04/2026Blog Categories
As the second quarter begins, the war in Iran, now entering its second month, remains the dominant economic story. It’s unclear how long the war will last, and markets have reacted accordingly.
Stocks started the year strong, but have declined since the war began on Feb. 28. The S&P 500 fell more than 4% during the first quarter, and the Nasdaq entered correction territory. Volatility has risen as the market attempts to keep up with the rapidly changing global situation.
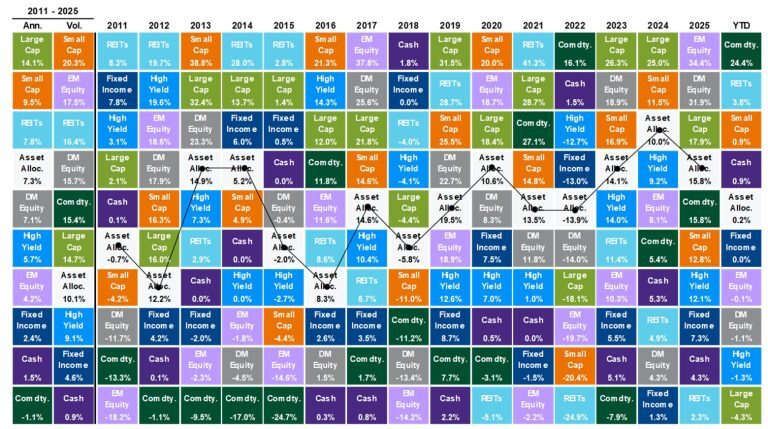
What happens next depends on a series of interrelated variables that are, by definition, unknowable. It can be tempting to try to interpret every headline and adjust your portfolio accordingly. But when the outcomes are unknowable, that approach is just guessing and gambling. For now, let’s get a pulse check on things three months into the new year (YTD through 3-31-2026):
A commonly observed metric of stocks is the price-to-equity ratio (P/E). The forward P/E has pulled back from a recent high @23 and now sits just below 20. The 30-year average P/E ratio for the index is @ 17. Many use this measure to gauge whether large U.S. stocks are fairly valued (or over- or undervalued).
Most stock sectors struggled in the quarter, but a handful of them delivered excellent returns. Energy was a clear standout, up nearly 38%. Materials and utilities delivered returns of ~11% and ~8%, respectively. Financials, technology, and discretionary stocks were all down ~8%. The tech-heavy Nasdaq lost more than 6%.
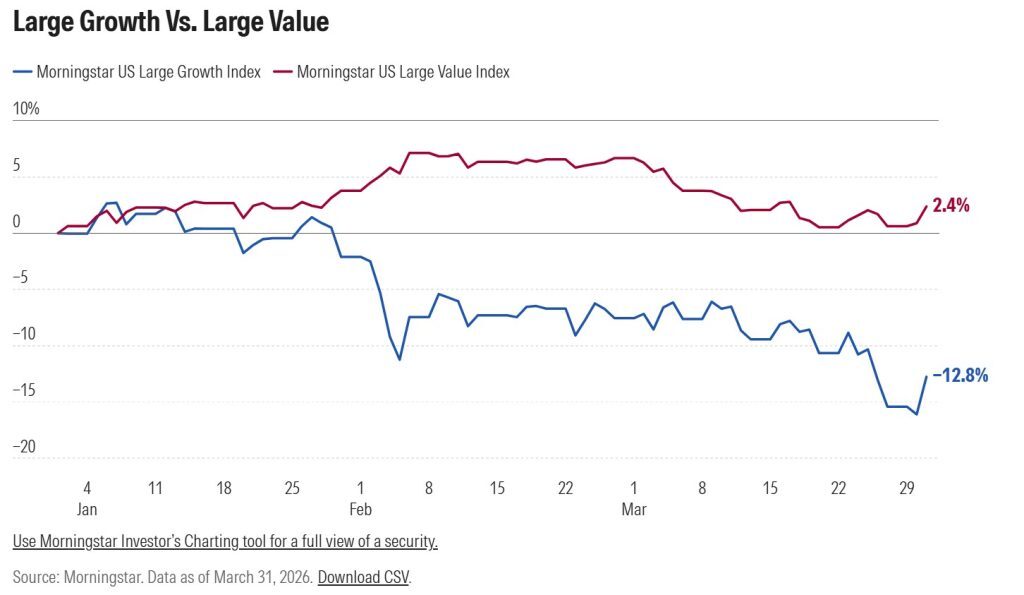
Here’s how the large U.S. companies did in Q1, when separating the value stocks from the growth stocks. Large value continued its outperformance dating back to last year, largely because many energy stocks (i.e., ExxonMobil) are considered value companies:
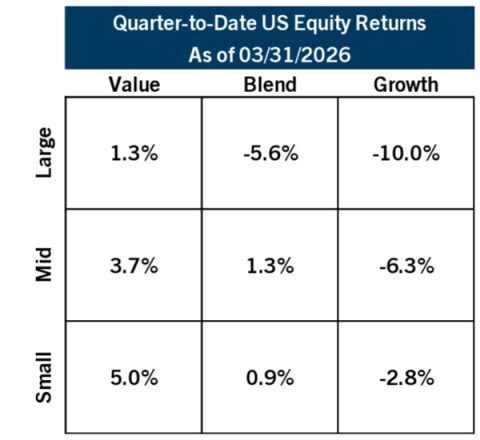
We saw nice returns in small-cap stocks to start the year, a shift from their underperformance in 2025. We’ll continue to allocate a certain percentage of portfolios to small caps and, specifically, overweight small-cap value companies.
International markets were relatively flat to slightly negative. As in U.S. markets, international companies saw much of their YTD gains erased as March wore on.
In the bond market, yields increased over the quarter. Yields on the 10-year Treasury note started at 4.18%, dipped below 4% pre-war, then jumped higher to around 4.3% by quarter-end. Average 30-year mortgage rates mirrored this movement, dipping below 6% at one point before creeping higher to the mid-6% range.
Gold lost its shine in March, pulling back from a January high of $5,300 $4,679. But gold prices are still up @8-9% for the year despite the pullback. Oil, gold, and other commodities boosted that “commodity” sector to a solid Q1 performance.
Crude oil prices started the year at $57 per barrel but now trade over $101 per barrel due to the conflict in Iran and global oil shortages. This sharp move higher has revived inflation fears because of how much consumers are paying at the pump and the prices airlines are paying for fuel, etc.
Lastly, volatility has jumped higher. We typically see this measured by the VIX level, which has traditionally averaged @ 20. Over the quarter, we saw it jump from 15 to over 30 due to global uncertainty. Now it’s hovering around 25, but it’s something we watch. We consider volatility “the price of admission” for long-term portfolio growth, and we continue to look for opportunities to use that volatility to our advantage.
Whatever happens to energy costs will have a big impact on overall inflation. In turn, the outlook for inflation will affect Federal Reserve interest rate policy. On Feb. 27, the day before the war, Wall Street traders were expecting two to three interest rate cuts in 2026. Now, a rate hike appears increasingly plausible.
Fed policy has big implications for the economy. Rate hikes raise the cost of borrowing, which can cool economic growth.
So while wars can move markets in the short run, we typically see stock returns driven by economic growth and corporate earnings. Both of those still look positive, and amazingly, earnings have been revised higher even since the war with Iran commenced.
That’s why we create an investment plan designed to accommodate uncertainty. Diversification across asset classes, sectors, styles, and geographies helps manage uncertainty by providing downside protection while maintaining upside potential.
Remember that investing, at its core, is an exercise in navigating the unknown. The future is unpredictable, and sources of long-term returns are rarely obvious in advance. In fact, it’s the uncertainty about the future that fuels stocks’ long-term growth potential: the equity risk premium compensates investors for the risk of the unknown.
Evolving headlines will continue to create uncertainty in the weeks and months ahead. Through it all, keeping your portfolio aligned with your long-term goals gives you the best chance of achieving them.
Brandon
Stocks started the year strong, but have declined since the war began on Feb. 28. The S&P 500 fell more than 4% during the first quarter, and the Nasdaq entered correction territory. Volatility has risen as the market attempts to keep up with the rapidly changing global situation.
What happens next depends on a series of interrelated variables that are, by definition, unknowable. It can be tempting to try to interpret every headline and adjust your portfolio accordingly. But when the outcomes are unknowable, that approach is just guessing and gambling. For now, let’s get a pulse check on things three months into the new year (YTD through 3-31-2026):
Source: Bloomberg, FactSet, MSCI, NAREIT, Russell, Standard & Poor’s, J.P. Morgan Asset Management. Large Cap: S&P 500, Small Cap: Russell 2000, EM Equity: MSCI EME, DM Equity: MSCI EAFE, Comdty: Bloomberg Commodity Index, High Yield: Bloomberg Global HY Index, Fixed Income: Bloomberg U.S. Aggregate, REITs: NAREIT Equity REIT Index, Cash: Bloomberg 1-3m Treasury. The “Asset Allocation” portfolio is for illustrative purposes only and assumes annual rebalancing with the following weights: 25% in the S&P 500, 10% in the Russell 2000, 15% in the MSCI EAFE, 5% in the MSCI EME, 25% in the Bloomberg U.S. Aggregate, 5% in the Bloomberg 1-3m Treasury, 5% in the Bloomberg Global High Yield Index, 5% in the Bloomberg Commodity Index, and 5% in the NAREIT Equity REIT Index. Annualized (Ann.) return and volatility (Vol.) represents the period from 12/31/2009 to 12/31/2025. Please see the disclosure page at the end for index definitions. All data represent total return for stated period. Past performance is not indicative of future returns.
Looking back, here are some observations:
Most people look at the performance of the S&P 500 Index, so we’ll start there. The Index followed 3 consecutive double-digit return years with a -4.33% for the quarter. Not terrible, but given that the index was up 6% at one point in January, this is viewed as a 10% pullback (i.e., a correction). The tech-heavy Nasdaq was down slightly more than that, losing more than 6%.A commonly observed metric of stocks is the price-to-equity ratio (P/E). The forward P/E has pulled back from a recent high @23 and now sits just below 20. The 30-year average P/E ratio for the index is @ 17. Many use this measure to gauge whether large U.S. stocks are fairly valued (or over- or undervalued).
Most stock sectors struggled in the quarter, but a handful of them delivered excellent returns. Energy was a clear standout, up nearly 38%. Materials and utilities delivered returns of ~11% and ~8%, respectively. Financials, technology, and discretionary stocks were all down ~8%. The tech-heavy Nasdaq lost more than 6%.
Here’s how the large U.S. companies did in Q1, when separating the value stocks from the growth stocks. Large value continued its outperformance dating back to last year, largely because many energy stocks (i.e., ExxonMobil) are considered value companies:
We saw nice returns in small-cap stocks to start the year, a shift from their underperformance in 2025. We’ll continue to allocate a certain percentage of portfolios to small caps and, specifically, overweight small-cap value companies.
Source: Bloomberg
International markets were relatively flat to slightly negative. As in U.S. markets, international companies saw much of their YTD gains erased as March wore on.
In the bond market, yields increased over the quarter. Yields on the 10-year Treasury note started at 4.18%, dipped below 4% pre-war, then jumped higher to around 4.3% by quarter-end. Average 30-year mortgage rates mirrored this movement, dipping below 6% at one point before creeping higher to the mid-6% range.
Gold lost its shine in March, pulling back from a January high of $5,300 $4,679. But gold prices are still up @8-9% for the year despite the pullback. Oil, gold, and other commodities boosted that “commodity” sector to a solid Q1 performance.
Crude oil prices started the year at $57 per barrel but now trade over $101 per barrel due to the conflict in Iran and global oil shortages. This sharp move higher has revived inflation fears because of how much consumers are paying at the pump and the prices airlines are paying for fuel, etc.
Lastly, volatility has jumped higher. We typically see this measured by the VIX level, which has traditionally averaged @ 20. Over the quarter, we saw it jump from 15 to over 30 due to global uncertainty. Now it’s hovering around 25, but it’s something we watch. We consider volatility “the price of admission” for long-term portfolio growth, and we continue to look for opportunities to use that volatility to our advantage.
Additional Discussion Points:
In today’s environment, we find ourselves navigating a landscape of unknowns. An immediate resolution to the war could lead to a steep drop in energy costs, but a protracted quagmire might push them to extreme highs.Whatever happens to energy costs will have a big impact on overall inflation. In turn, the outlook for inflation will affect Federal Reserve interest rate policy. On Feb. 27, the day before the war, Wall Street traders were expecting two to three interest rate cuts in 2026. Now, a rate hike appears increasingly plausible.
Fed policy has big implications for the economy. Rate hikes raise the cost of borrowing, which can cool economic growth.
So while wars can move markets in the short run, we typically see stock returns driven by economic growth and corporate earnings. Both of those still look positive, and amazingly, earnings have been revised higher even since the war with Iran commenced.
Final Thoughts:
I always encourage my clients to consider why they’re investing in the first place. The goal isn’t to outsmart the markets today or tomorrow or the next day, but to improve your ability to build the life you want.That’s why we create an investment plan designed to accommodate uncertainty. Diversification across asset classes, sectors, styles, and geographies helps manage uncertainty by providing downside protection while maintaining upside potential.
Remember that investing, at its core, is an exercise in navigating the unknown. The future is unpredictable, and sources of long-term returns are rarely obvious in advance. In fact, it’s the uncertainty about the future that fuels stocks’ long-term growth potential: the equity risk premium compensates investors for the risk of the unknown.
Evolving headlines will continue to create uncertainty in the weeks and months ahead. Through it all, keeping your portfolio aligned with your long-term goals gives you the best chance of achieving them.
Brandon